Gaussian Distribution |

|
|
The J&L Financial Planner Monte Carlo Analysis allows you to select three methods to generate random return rates for your investments.
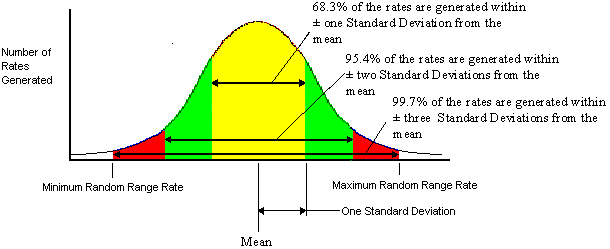
The first two methods use the concept of the Gaussian Distribution. Gaussian DistributionThis distribution is also known as a normal distribution. When the random rates are generated they form a "bell shaped" distribution about the Mean (average) rate. In fact, the Gaussian Distribution distributes the random rates such that 68.3 percent of the rates will fall within plus or minus one Standard Deviation from the Mean. 95.4 percent of the rates are generated within plus or minus two Standard Deviations from the Mean, and 99.7 percent of the rates will fall within plus or minus 3 Standard Deviations from the Mean. Standard DeviationThe Standard Deviation of an investment is a measure of how the return rates over a measure of time have clustered about the average rate for that same period of time. Generally the standard deviation that is quoted by your mutual fund company is an annualized standard deviation based on a fund's monthly performance over the past 36 months. The importance of standard deviation is that it measures the variability of investment returns over time. The standard deviation helps you give a number to the risk associated with your investment. Referring to the Figure 1.0 above, 68.3% of the time, the return on your investment will fall between two figures on either side of the mean. This corresponds to one standard deviation. The mean is the average return on your investment. If a stock has a mean return of 10 percent and a standard deviation of 10, then 68.3 percent of the time your return will fall somewhere between 0.0 and 20 percent. 95.4 percent of the time, your return should fall within plus or minus two standard deviations of the mean. In the example above this would mean that 95.4 percent of all returns are likely to fall between -10.0 and 30.0 percent. If one investment has a higher standard deviation than another that investment represents a higher investment risk, especially in the short term. Also, it must be stated, the standard deviation is a better measure of risk when comparing similar investments. Random Gaussian Rates Within a Given RangeThis option uses your investments Minimum Return Rate and Maximum Return Rate to generate a random Gaussian distribution of rates. The program calculates the mean from these rates and uses a Gaussian Random Rate program to generate the rates. If your investment has a minimum rate of -10.0 percent and a maximum return rate of +30.0 percent 68.3 percent of the generated return rates will fall between 0.0 and 20.0 percent. Random Uniform Rates Within a Given RangeThis option uses your investments Minimum Return Rate and Maximum Return Rate to generate a random uniform distribution of rates. Each time a random investment rate is generated it has an equal probability of being any rate in the range from the minimum return rate to the maximum return rate. Given a large number of trials all rates from the minimum to maximum will be generated in equal numbers. As far as the analysis is concerned this represents a worst case scenario. |
Copyright ©
1997-2021 J&L Software LLC
All Rights Reserved